Category Archives: PostgreSQL

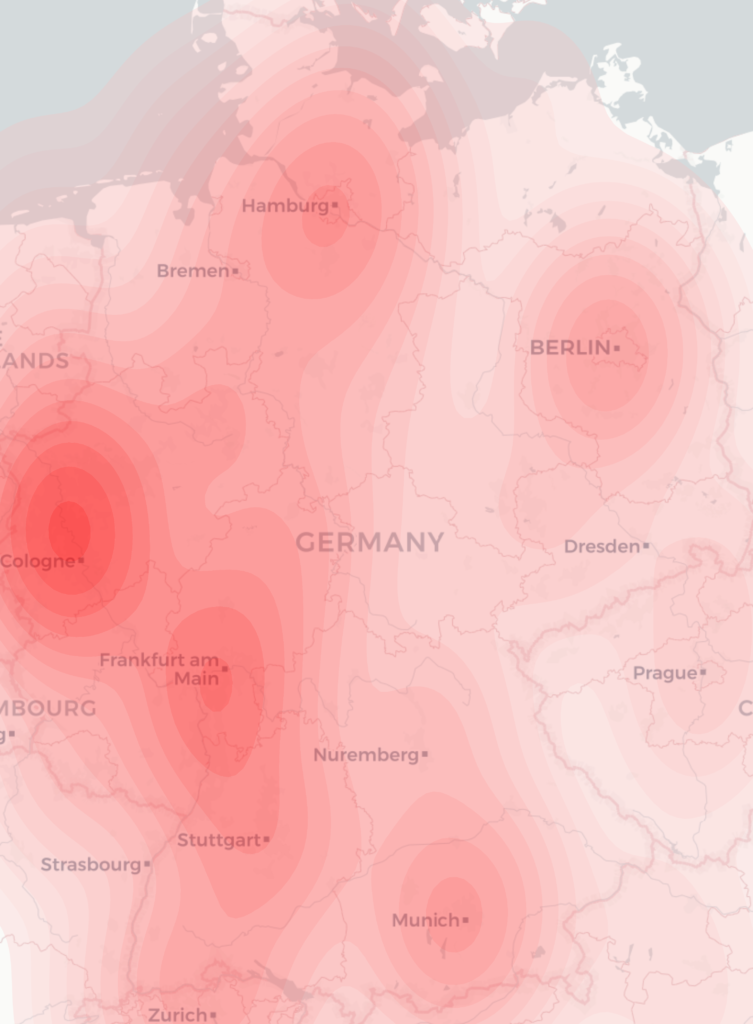
How to generate good-looking geographical heatmaps

For a project recently I needed to produce a geographical heatmap with millions of data points. I first tried using R with OpenStreetMap rendering, but I couldn’t make the heatmap display as flexibly as I wanted. Then, a friend suggested I try using python with the geopandas library. Even then, inspite of some examples in the manual and even a heatmap-based example, I couldn’t make the map look how I wanted with the interfaces that were exposed.

There were a number of issues:

  • My data was weighted, but there is no support for a weighted heatmap – all points are considered equal
  • I want to have a nicer map which has town names on etc. Ideally the cartodb light style
  • My data was heavily weighted to certain locations, so I wanted to run some logarithmic function on the weights generated by the heatmap algorithm to make the data more easily visible
  • The standard heatmap setup assumes there is nothing other than a map outline so by default is not transparent at all
  • I want to include this data in a report so all I want is a single png image output, rather than having the axis lines, various paddings etc on the graph

So, looking through the geopandas code (which mostly relies on seaborn kdeplot) to generate heatmaps I pulled out various bits into my program so that I could have full control over these processes. Here is a short runthrough of the resulting code:

First, we include libraries, read command-line values and set up the area of our map as a geopandas object

import contextily as ctx
import geopandas
import matplotlib.pyplot as plt
import numpy as np
import pandas
import scipy.stats
import seaborn.palettes
import seaborn.utils
import sys

input_file = sys.argv[1]
output_file = sys.argv[2]
langs = sys.argv[3].split(',')
country_codes = sys.argv[4].split(',')

max_tiles = 10

world = geopandas.read_file(geopandas.datasets.get_path('naturalearth_lowres'))

if country_codes[0] == 'list':
    pandas.set_option('display.max_rows', 1000)
    print(world)
    sys.exit()

# Restrict to specified countries
if country_codes[0] == 'all':
    area = world[world.continent != 'Antarctica']
else:
    area = world[world.iso_a3.isin(country_codes)]

Then, we pull out the bounds both in latlng format and convert the area into Spherical Mercator for web display. We need to plot everything in this so that we can pull in open street map tiles for the background later.

latlng_bounds = area.total_bounds
area = area.to_crs(epsg=3857)
axis = area.total_bounds

# Create the map stretching over the requested area
ax = area.plot(alpha=0)

We now read in the CSV and drop any data that we wouldn’t display:

df = pandas.read_csv(input_file,
    header=None,
    names=['weight', 'lat', 'lng'],
    dtype = {
        'weight': np.int32,
        'lat': np.float64,
        'lng': np.float64,
    }
)

df.drop(df[
            (df.lat < axis[1]) | (df.lat > axis[3]) | (df.lng < axis[0]) | (df.lng > axis[2])     # outside bounds of country
    ].index, inplace=True)

NOTE: I tried doing .to_crs() on the CSV data using normal lat/lng representation to convert into Spherical Mercator but it was very slow. As I’m generating the data itself from PostGIS I just run the conversion in that instead. The data I have is basically using the freely available MaxMind geoip database to generate a list of lat/lng/radius. I then pick a random point within that radius to output to the CSV file using a query like:

SELECT ST_AsText(ST_GeneratePoints(ST_Transform(ST_Buffer(location, radius)::geometry, 3857), 1)), ...

Then comes the hard bit – converting these values into the heatmap using an algorithm called KDE. These bits were lifted and simplified from the kdeplot routines mentioned above, but fortunately although not exposed by seaborn the underlying scipy.stats module contains a weighted KDE which is easy to use.

# Calculate the KDE
data = np.c_[df.lng, df.lat]
kde = scipy.stats.gaussian_kde(data.T, bw_method="scott", weights=df.weight)
data_std = data.std(axis=0, ddof=1)
bw_x = getattr(kde, "scotts_factor")() * data_std[0]
bw_y = getattr(kde, "scotts_factor")() * data_std[1]
grid_x = grid_y = 100
x_support = seaborn.utils._kde_support(data[:, 0], bw_x, grid_x, 3, (axis[0], axis[2]))
y_support = seaborn.utils._kde_support(data[:, 1], bw_y, grid_y, 3, (axis[1], axis[3]))
xx, yy = np.meshgrid(x_support, y_support)
levels = kde([xx.ravel(), yy.ravel()]).reshape(xx.shape)

The levels output variable is then the weights of all points on the heatmap we are going to output. We can apply a mathematical function to this (in this case take the quintic root) in order to scale the data appropriately, and output:

cset = ax.contourf(xx, yy, levels,
    20, # n_levels

    cmap=seaborn.palettes.blend_palette(('#ffffff10', '#ff0000af'), 6, as_cmap=True),
    antialiased=True,       # avoids lines on the contours to some extent
)

By generating a palette ourselves we can add an alpha channel to each aspect so that the underlying map will be visible. However there is quite a lot of noise at the lower levels so we want to hide all of them completely:

# Hide lowest N levels
for i in range(0,5):
    cset.collections[i].set_alpha(0)

We then add in the OSM base tiles, which is a bit of a mess as the contextily library seems a bit immature:

def add_basemap(ax, latlng_bounds, axis, url='https://a.basemaps.cartocdn.com/light_all/tileZ/tileX/tileY@2x.png'):
    prev_ax = ax.axis()
    # TODO: Zoom should surely take output pixel request size into account...
    zoom = ctx.tile._calculate_zoom(*latlng_bounds)
    while ctx.tile.howmany(*latlng_bounds, zoom, ll=True) > max_tiles:      # dont ever try to download loads of tiles
        zoom = zoom - 1
    print("downloading %d tiles with zoom level %d" % (ctx.tile.howmany(*latlng_bounds, zoom, ll=True), zoom))
    basemap, extent = ctx.bounds2img(*axis, zoom=zoom, url=url)
    ax.imshow(basemap, extent=extent, interpolation='bilinear')
    ax.axis(prev_ax)        # restore axis after changing the background

add_basemap(ax, latlng_bounds, axis)

Finally we can tweak some of the output settings and save it as a png file:

ax.axes.get_xaxis().set_visible(False)
ax.axes.get_yaxis().set_visible(False)
ax.set_frame_on(False)

plt.savefig(output_file, dpi=200, format='png', bbox_inches='tight', pad_inches=0)
The hardest task to do well in every frontend/backend system – paging

What is the hardest code to write efficiently in pretty much every frontend and backend system? I think it is paging.

Nearly every system I’ve worked on as full-stack developer has had some sort of reporting whether it is searching and filtering or news-feed style item display, all of these depend on paging. Whilst simple paging is trivial to implement, making it work quickly at scale is a very tricky challenge.

A simple approach (based on SQL, but could be with any backend data store) would be something like:

items = SELECT * FROM <table> WHERE <query> ORDER BY <order> LIMIT <rows>,<offset>;
count = SELECT COUNT(*) FROM <table> WHERE <query>;

It looks simple and it works in small-scale development systems. But there a massive number of issues and inefficiencies with this approach:

  • Whilst you need to redo the items query for every page, the count query only needs to be done once for each <query>. Counting is a very expensive operation as it essentially has to fetch all the rows, unless there are some very well optimized keys on your table. This especially the case if you are running over a table larger than a few megabytes on a mobile device, so you need to cache this as much as possible.
  • Often times as the <order> logic has gotten more and more complex I’ve found myself in a situation where some rows are equal in ordering and so they can move around as you switch between pages or redo the query. Always ensure that the last item of ordering is something which is well ordered to avoid this, for example an integer primary key
  • What happens with a LIMIT/OFFSET type query if you get a row inserted before the OFFSET? All the rows shift forwards by one so when you scroll down on your infinite feed you get a duplicate, or the user goes to the next page and sees a repeat of the last entry of the previous page. What happens when a row prior to the OFFSET is deleted? A row between the pages is not seen by the user. In some databases it may be possible to use a long-lived cursor but often in stateless backends for webapps this is not possible. Wherever possible you should try to get a column on the <order> which is simply increasing or decreasing and redo the previous query with use a > against that to ensure you fetch all the rows from the previous point the user saw regardless of what changed above it. This is easy when sorting by primary key, difficult or even impossible otherwise.
  • How do you handle a laggy backend when the user presses the next button multiple times? Does it re-fire the request for the next page multiple times to the backend (consuming unnecessary resources), ignore any presses after the first (better), or does it proceed forward multiple pages, potentially running past the last page and onto blank pages? I’d usually opt for the second approach but limiting so that it always stops on the last page, but it may vary depending on usage case (would users typically want to skip multiple pages quickly, or always want to page through one-at-a-time), backend latency (ie is the data stored locally or remotely, what is the connectivity like)
  • Following on from the above, if you are firing multiple requests for pages, or for infinite scrolling how do you cope with the fact that responses can come back out-of-order? Many times I see it would simply display the content from the last page returned, but this is open to a number of bugs if you are talking about remote services over wireless
  • How do you efficiently abort in-fly calls and database queries if the user changes page – on a large system this could be a significant performance gain

There are quite a large number of optimizations that can be done with paging code, whether this is with a remote backend or locally, for example:

  • Prioritize getting the first page of data to display, say “Showing results 1-50 of …” while the count is loading
  • Track historical data on how long it takes to generate counts or paging, and especially if running single-threaded (eg on a mobile device), delay the count until the main queries have completed and there is some idle time
  • Is it possible to parallelize the two querys against the database so that the query takes half the real-time for the user? Can you use non-blocking IO to open two database connections, one for each query and return a response when both have completed? Can you run 2 separate queries one for count and one for items and update your pager and results separately? For a few rows in a test system this won’t make any difference, but over millions of rows, especially if you need an accurate count, this can save seconds of time
  • Do you actually need a totally accurate count, or can you approximate it, does your database backend support something like this for queries? This can save significant time and resources
  • Have you set up good indexes and verified that they are correctly being used at the scale that you will have in your live environment? Do you optimize well for the common use case?
  • You don’t always need to bother running a count query – if the items returned are less than the items requested you know that you have finished paging and you can automatically count the total from that. This is true whether on the first on the 100th page.
  • Fetch the number of rows that you want to display plus one, so that you know if there is a next page or not. If the number of items is less than you requested you know there won’t be a next page no matter what the total actually is
  • If running on mobile devices or html, limit the number of items that are displayed on an infinite scroller as this can be very memory intensive. Perhaps allow infinite scrolling over 500-1000 rows and then put a next button at the bottom of the page. Or you can do some trickery to replace the top items with a large blank box but this can be very complex and difficult to do well
  • Don’t display a spinner when infinite scrolling (you are starting to load more items before the user hits the bottom of the list right?) Only display the spinner after a short time period or when the user hits the very bottom of the list to give visual feedback that there are more items loading to display

If this looks like a lot to think about, I don’t disagree. Simple, buggy and inefficient paging is easy to do, but fully-optimized, highly responsive complex paging is very tricky to do well. But if you want to scale your app you need to focus on this.

Running lots of postgres commands in parallel

Postgres is great, however one limitation is that you can only run one command at a time in the shell. Sometimes however when you are doing administrative functions over multiple tables, for example (re)creating indexes or vacuuming and you have a nice powerful box, you can run many of these commands in parallel for easy speedup. Here’s an easy way to run lots of commands in parallel.

Firstly, create a text file with one command per line. For example

vacuum full a;
vacuum full b;
vacuum full c;
vacuum full d;

Then, ensure that you have your .pgpass file set up correctly so that you can just run psql [database] [user] without being prompted for a password.

Finally, run the following command:

xargs -d "\n" -n 1 -P 20 psql database_name username -c < list_of_commands.txt

-P 20 specifies the number of jobs to run in parallel so change this to what your server can cope with.

Finding the amount of space wasted in postgres tables

Because of way that postgres handles transaction isolation (ie using MVCC), when you modify or delete a row in a table it marks it as deleted, and then frees the space at a later point in time using (auto)vacuum. However, unless you use the heavy-weight VACUUM FULL command (which exclusive locks the table and totally rewrites it, causing anything trying to access it to block until the command is finished) the space is never reclaimed by the operating system. Normally this is not a problem – if you have a heavily used table with 20mb of data in it it probably has 5-10mb of overhead with the dead rows, reclaimed free space etc which is acceptable. However there are a few situations where it is useful to know what exactly the overhead is:

  1. Sometimes if your table changes very quickly, is large, and your disks or autovacuum parameters are unable to keep up, it can end up growing massive. For example we had a table that contains 3Gb of data but was taking up 45Gb due to the fact that autovacuum couldn’t keep up with the frequency of changes in the table
  2. If you are using table partitioning to store historic data then to make the most use of space you want to see whether a VACUUM FULL would be advantageous to run or not. For example if you have a table that is recording data collected from each day, some days it may be mostly just inserts so doesn’t need vacuuming; other days it may have a number of changes made and so have quite a lot of free space that can be reclaimed. Additionally, VACUUM FULL optimizes the order of data in the table and the indexes making it more performant.

In the first case, looking at the output of a command like

SELECT
    psut.relname,
    to_char(psut.last_vacuum, 'YYYY-MM-DD HH24:MI') as last_vacuum,
    to_char(psut.last_autovacuum, 'YYYY-MM-DD HH24:MI') as last_autovacuum,
    pg_class.reltuples::bigint AS n_tup,
    psut.n_dead_tup::bigint AS dead_tup,
    CASE WHEN pg_class.reltuples > 0 THEN
        (psut.n_dead_tup / pg_class.reltuples * 100)::int
    ELSE 0
    END AS perc_dead,
    CAST(current_setting('autovacuum_vacuum_threshold') AS bigint) + (CAST(current_setting('autovacuum_vacuum_scale_factor') AS numeric) * pg_class.reltuples) AS av_threshold,
    CASE WHEN CAST(current_setting('autovacuum_vacuum_threshold') AS bigint) + (CAST(current_setting('autovacuum_vacuum_scale_factor') AS numeric) * pg_class.reltuples) < psut.n_dead_tup THEN
        '*'
    ELSE ''
    END AS expect_av
FROM pg_stat_user_tables psut
    JOIN pg_class on psut.relid = pg_class.oid
ORDER BY 5 desc, 4 desc;

(sorry I can’t remember where I found this) should show you that there are a very large number of dead tuples waiting to be reclaimed (ie turned in to free space) in the table.

However, if your disks were struggling at one point, but then you tweaked autovacuum so it reclaimed the dead tuples correctly (as in case 1 above), your table could now be 90% free space but there is no easy way to find this out within postgres.

Fortunately, there is an excellent extension called pgstattuple which allows you to find out the amount of free space within a table file that has been reclaimed but not released to the operating system. The following query lists all tables which are over 100Mb in size, and have more than 10Mb of free space and have more than 20% free space (you can tweak these numbers – I just did it for our platform where our typical table size is 1Gb+):

select
    table_schema,
    table_name,
    free_percent,
    pg_size_pretty( free_space ) AS space_free,
    pg_size_pretty( pg_relation_size( quoted_name ) ) AS total_size
from (
    select
        table_schema,
        table_name,
        quoted_name,
        space_stats.approx_free_percent AS free_percent,
        space_stats.approx_free_space AS free_space
    from
        ( select *,
            quote_ident( table_schema ) || '.' || quote_ident( table_name ) AS quoted_name
            from information_schema.tables
            where
                table_type = 'BASE TABLE' and table_schema not in ('information_schema', 'pg_catalog')
                and pg_relation_size( quote_ident( table_schema ) || '.' || quote_ident( table_name ) ) > 100000000
        ) t, pgstattuple_approx( quoted_name ) AS space_stats
) t
where
    free_percent > 20
    AND free_space > 10000000
ORDER BY free_space DESC;

This only uses an approximate count, however even so it can be a bit slow (it just took 10 minutes here) on a system with many tables and heavy IO. You can use this to find the tables that would most benefit from a VACUUM FULL command being run.

row_to_json() equivalent for jsonb types

With the advent of the awesome jsonb data type in Postgres 9.4, pretty much all of the json-related functions have a json_* and jsonb_* varient. All those, except row_to_json. I spent a bit of time but couldn’t find an answer online, in the end after a bit of experimentation, I discovered that in Postgres 9.5 at least the to_jsonb function does exactly the same, like:

SELECT to_jsonb(table.*)
FROM table

How we improved database performance 1000% with just one command

In my current contract we have a nice database server with 4 datacentre quality SSD’s arranged in raid5, a battery-backed (Dell PERC / megaraid) controller and very poor disk performance. As I was doing a dump of the database (with parallel process, obviously), iostat was showing 100% disk utilization at 200-300 iops and 40-60mb/sec. Really not what it should be. After poking the raid card a lot with the MegaCli tool, I discovered that by changing the Linux IO scheduler to noop or deadline we suddenly got great performance – 50% disk utilization at 1300 iops and 200mb/sec read. So, an issue with the CFQ scheduler then as everywhere seems to suggest? In fact not – it turns out the root of the problem is that because of the raid controller the kernel did not detect that the underlying disks were SSD rather than HDD. Just by tweaking this setting CFQ provides the same performance as noop or deadline schedulers (in fact better for our postgres workload). So, here’s the command we used to get a 1000% improvement in database performance:

echo 0 > /sys/block/sdb/queue/rotational

Getting value/count grouping in a single row with postgres

In one of my contracts we’re doing some very complex data storage and querying using jsonb in postgres. One common display in the system we’re replacing is basically something like:

SELECT
  sum( IF( val between 91 and 92, 1, 0 ) ) val_91,
  sum( IF( val between 92 and 93, 1, 0 ) ) val_92,
  sum( IF( val between 93 and 94, 1, 0 ) ) val_93,
  ...
  GROUP BY somecol

Which is horrible, inefficient and doesn’t let you know if anything occurred outside the range. As we’re already doing a lot with JSON, I was wondering if rather than creating new columns, we could return these counts in a JSON format. It turns out that with postgres this is really easy – here’s how:

First, we want to create a function that given the existing aggregated value and a new key to inclement, returns a jsonb object

CREATE FUNCTION agg_count_values( state jsonb, key text ) RETURNS jsonb STRICT AS $$
    SELECT state || jsonb_build_object(
        key,
        -- extract the current value, or 0 if the key doesn't exist yet
        COALESCE(( jsonb_extract_path_text( state, key ) )::int, 0) + 1
    );
$$ language SQL;

Then, you define the aggregate:

CREATE AGGREGATE count_values( text ) (
    sfunc = agg_count_values,
    stype = jsonb,
    initcond = '{}'
);

If you noticed the STRICT in the function (which means that NULL’s are not allowed), the aggregate we created notices that and will never pass NULL values in to the function meaning we don’t need to special-case them.

If you then run the query first casting the floating-point value into an integer and then turning that into a text datatype for the json key:

SELECT count_values( val::int::text )
  GROUP BY somecol;

You get a JSON result back with the counts:

{"93": 1, "94": 2, "95": 1, "96": 5, "97": 2, "98": 4, "99": 6, "100": 6, "101": 7, "102": 5, "103": 5, ...}
...

Obviously your first port of call when faced with something like this is ‘can I group by the value’, but in this case we want the row to be based on something different so we needed the sub-aggregation of the values.

Happy days

How we tweaked Postgres upsert performance to be 2-3* faster than MongoDB

As we all know, relational databases are fine if you’re dealing with small amounts of data but for web-scale high performance high inserts speed and masses of queries per second, NoSQL is what you need. At least, that’s the conventional wisdom/hype surrounding NoSQL databases such as MongoDB. However as we’ve recently discovered this is very wrong indeed.

As the conventional wisdom said that, we went with MongoDB for our first attempt at a system that needed to support a very high number of upserts – we were aiming for 50-100k upserted rows per second of unstructured data to be exact. Initial attempts with MongoDB on some very nice hardware (2Tb SSD SAN) produced about 10k upserts per second – good but not great. Then, this number increased when we started using batched upsert operations that was added in MongoDB 2.6, and increased even further with the advert of MongoDB 3.0 and the WiredTiger storage backend to 30-50k upserts/second. Very nice!

However, there are a number of issues with MongoDB in particular and limitations on NoSQL databases in general that relational (SQL) databases make easy – want to do aggregation, joins, distinct row selection from an index, complex data manipulations before transmitting data over the nework? Easy with SQL, virtually impossible with NoSQL. So, we started to think that if we could find a relational database with even vaguely good insert performance it would make life and development tasks so much easier that perhaps it would be worth the effort to change. As postgres generally seems to be able to handle anything you can throw at it, including support for a binary JSON data type we started looking there.

In order to avoid changing our database code very much so that we could compare as closely with MongoDB as possible, I created a really simple schema for the tables – the column(s) required for a primary key, and a jsonb data type column to store the record. One great feature of the recently released Postgres 9.5 release is the single statement upsert ability that reduces latency and code complexity, so all testing was done on this. As Postgres is designed from the ground up to be reliable and not lose data (unlike MongoDB which has fsync disabled by default), it is very slow if you are just doing single inserts. When you start batching these in to transactions of say 100 or 1000 entries you can achieve a higher throughput. If you want to compare it with MongoDB though, you can choose to disable the fsync at the end of every transaction by using the command

SET LOCAL synchronous_commit TO OFF

This means that in the event of a power failure you may lose some transactions that returned successfully, however you will never risk getting database corruption (unlike with MongoDB). By setting this one command you get performance in line with MongoDB – 50k upserts per second. However this was pushing 500Mb/sec of disk bandwidth which was saturating even the SSD array.

But Postgres has a few more tricks up its’ sleeve. One of the downsides of Postgres being incredibly protective of data is that it has a lot of writes – first it writes all commands to the ‘Write-Ahead Log’ (WAL) and then it updates the underlying data and indexes, and the WAL is where much of this additional disk IO was coming from. Starting in Postgres 9.1 however there is a feature called ‘unlogged tables‘ which avoids writing to the WAL, at the cost of loosing the table data after an unclean shutdown. Enabling this is as simple as changing your ‘CREATE TABLE’ statement to ‘CREATE UNLOGGED TABLE’. When I switched to using unlogged tables, disk IO went to virtually nil for most of the run (just at the end when it flushed the tables to disk did it dump several hundred MB of data – the database and indexes) and we saw a throughput of 85k upserts per second – roughly twice that of Mongo. The downside of this is that at an unclean shutdown, unlogged tables are automatically truncated as they may be in an inconsistent state. My proposal would be to allow a method to mark an unlogged table as read-only in order to ‘freeze’ its state hence negating the need to truncate after a crash; however apparently this would be a bit tricky to implement.

Because we want to do lots of searches with our data we heavily rely on indexes. On Postgres these appear to entail quite a bit more overhead than mongo. When I added 8 additional indexes to the unlogged table performance suddenly dropped from 85k upserts/sec to 35k upserts/sec. Fortunately there’s an easy solution to this in our case– create a table with just a single index for the primary key. Then create a ‘Materialized view‘ which is a clone of the table, and add the indexes to that. When your updates have finished, simply run “REFRESH MATERIALIZED VIEW”. This takes perhaps a minute to run on our data of 2m rows (as it is a single query, it is presently bounded to a single CPU), but it means that we get full upsert performance and the indexes then get updated inside a single transaction which should hopefully lead to less fragmentation and means better overall performance and less overall CPU usage at the cost of the materialized table lagging behind updated data by about 1 minute – an acceptable tradeoff in our case. By default “REFRESH MATERIALIZED VIEW” exclusively locks the materialized view while it is being update but you can fix this at the cost of some additional CPU cycles by changing that to “REFRESH MATERIALIZED VIEW CONCURRENTLY”. Your commands then look like:

-- Run these once:
CREATE MATERIALIZED VIEW real_table AS select * from unlogged_pk_only_table;
CREATE INDEX ON real_table (…);

-- Run this when real_table updates complete
REFRESH MATERIALIZED VIEW CONCURRENTLY real_table;

So we’ve now got performance twice the speed of Mongo without tweaking any postgres performance parameters – can we do better? It turns out that some basic settings help improve performance pretty significantly:

shared_buffers = 3GB # Give postgres lots more memory to work with
effective_io_concurrency = 8 # We are on a nice RAID SAN – we can do multiple reads/writes at once

The following setting is key as well – we don’t want to commit at the end of a transaction because frequently we have massive of transactions on the same table. Instead, wait a short amount of time and then commit with any other transactions on the same table in a single batch:

commit_delay = 100000 # 100ms

With these settings, an unlogged table with a single primary key and a jsonb column can run at 100k upserts/second, roughly three times the insert performance of MongoDB.

As I mentioned above, one of the issues with upserting lots of data into a single table was that we were seeing massive IO spikes on that. It turns out that this can be significantly reduced by changing the checkpointing settings too. There’s a small sentence in the manual that is key here: “To ensure data page consistency, the first modification of a data page after each checkpoint results in logging the entire page content” – basically if you checkpoint too frequently (and the default is after only 80mb of commands) after each checkpoint, if you are still updating lots of entries in the table, basically you entire table is rewritten to the WAL. To work around this (at the cost of causing longer recovery time after an unclean shutdown) we want to reduce the frequency of checkpoints with regard to the amount of data written (it will still write a checkpoint by default every 5 minutes anyway):

max_wal_size = 10GB
min_wal_size = 1GB

With these settings, even a standard logged table now runs at 80-90k upserts/sec and only outputs around 50Mb/sec of data.

TL;DR, one of the main areas of hype about NoSQL has been to do with the performance of inserting data. However, not only does Postgres 9.5 provide all the functionality of a mature and flexible SQL database, with a few tweaks it also handles upserts at two to three times the speed of MongoDB with better data consistency and lower memory and CPU usage.

Mongo DB Pain

In my latest contract we’re gathering a lot of data very quickly (100k inserts/sec would not be unreasonable) and trying to save it into a database. Before I started the contract the decision had been made to use Mongo Database for this very reason, so when I joined I was glad to finally get a chance to play with some NoSQL software – up until now I’ve just used MySQL and PostgreSQL. There’s some software and programming languages where the more you use them the more they pleasantly surprise you. AngularJS is one of those pieces of software where you start with basic templating and form-element binding but quickly discover there’s a mass of great plugins available. PostgreSQL is another case in point – I had been using MySQL quite happily for years but since starting to use PostgreSQL for some geolocation projects (with the excellent PostGIS extension), I’ve started using it by default for any new projects or designs. At the start it seems like just another database server with some geospatial additions, but then you think “Perhaps I can get the database to validate my input data before inserting”. No problem for Postgres you can specify a regexp constraint for example CHECK (mac ~ '^[0-9a-f]{12}$'::text) to validate a mac address (but you probably want to use the built-in type macaddr). Good luck with doing this in MySQL – by default it doesn’t even care about inserting the wrong data type into a column just silently messes it up… Or perhaps you want to import data from another data source into Postgres – again Foreign Data Wrappers (FDW) to the rescue connecting in to pretty much any other database or data source that you could want.

With Mongo however the more I’ve learnt of it the less impressed I’ve become. Sure, you can do some nice searches without needing schemas and it’s pretty high performance however once you go past simple store/retrievs there are some pretty basic issues that have not been addressed. Here are two I’ve come across in the past week:

Firstly, we have a big table (500m records) with data in a composite primary key (id, timestamp). We have the index on that, and we want to get a list of all the ids in the table. No problem you think – it’s a simple btree; just walk it and you’ll pull out the ids. And yes, it should be like this however there’s no easy way to do this in Mongo. The first thing you see in the documentation is that there is a .distinct() function or a .group() function. Great to get the distinct ids just run db.collection.distinct('id'). However rather than doing something sensible and returning the distinct fields with a cursor it tries to return them all in a single BSON object which is capped at 16mb size. So, if you have less then perhaps 1 million distinct ids in your table it would work, once you go over some magic threshold then your entire process needs redesigning.

Then you notice that in the latest versions of MongoDB, the .aggregate function can return a cursor. So, something like:

db.collection.aggregate( [ { $group: { _id: "$id" } } ], { cursor: {} } )

should do it. Technically speaking yes, however an open bug report from 4 years ago explains that actually the $group function can’t use indexes. If you add an explain: true to the aggregate you see that it does a full collection scan. But, perhaps if you are clever and force the sort like:

db.collection.aggregate( [ { $sort: { id: 1 } }, { $group: { _id: "$id" } } ], { cursor: {} } )

it will use the index, and indeed the explain output shows that it does. However even then it has to search through the whole table before it returns the first item for the cursor! So, if your distinct result is possibly more than 16mb of data in a large table there doesn’t seem to be any way to get the data in a timely manner from the database.

Another issue that I ran into and reported upstream is to do with very poor index selection on the aggregate. See the ticket for more details, but if you run an aggregate query on a collection with the foo column as a unique key:

db.col.aggregate([ { "$match" : { "foo" : "abcd" } }, { "$sort" : { "_id" : 1 } } ])

for some reason Mongo doesn’t follow the obvious and use the first item in the aggregate pipeline as the index. Instead, it chooses to use the _id index meaning that the $match does a full table scan to find the one result that could have been instantly looked up if it had used the correct index. The .find().sort() pipeline doesn’t have this issue.

There was also a fun issue I discovered whereby when you get a hot row in the database (for example a lot of processes trying to use $inc to update a counter) performance gets absolutely killed by the spinlocks on the data structure. Rather than 50k upsert/sec on the cluster when we had this hot row it went down to about 3k upserts/sec.

This is not to say that Mongo is a bad product, certainly looking at posts from a few years ago it seems that it has come on leaps and bounds since then. However it’s not the be all and end all that many NoSQL champions would claim. And I’m not convinced that the other NoSQL type databases would be all that much better – certainly for basic store/fetch operations but as you get closer to needing the functionality of a traditional RDBMS they are just too immature. Other issues for us recently have been lack of JOIN statements, the lack of schema that means a simple typo on a query can cause it to hang doing a full table scan for a key that doesn’t exist, etc etc. These are not problems with Mongo per-se but rather an issue with the incredible flexibility that NoSQL products offer.

Would I use Mongo again in other projects? Yes probably, but only if we had a requirement for very high performance or schema-less flexibility that something like PostgreSQL simply couldn’t provide.

How (not) to use PostgreSQL functional indexes

Working on a project where we want to store searchable (using LIKE, meaning we can’t use the inbuilt Postgres macaddr type) MAC addresses in a PostgreSQL table I decided create a unique index in order to only allow one modem per entry in the table and also to speed up searches. However we also want to ensure that we dodn’t get upper- and lower-case versions of the same MAC inserted. PostgreSQL to the rescue – you can create a functional index on the table:

create unique index on modem (( lower(mac) ));

Basically this means that it should first lowercase anything that gets inserted, and then check that the unique constraint isn’t violated. It should also mean that something like:

select 1 from modem where mac = ?

should be indexed and hence work really quickly.

However, while profiling the application I noticed the select statements getting slower and slower the more rows we put into the table – the classical way of seeing that a column is not properly indexed. Looking at the postgres manual I remembered that a functional index actually only speeds up queries where you apply the function to the column, for example something like the below would use the index:

select 1 from modem where lower(mac) = lower(?)

Functionally this was the same as what I was doing, but I didn’t want to have the hassle of remembering to apply that function everywhere we wanted to search by mac. In the end I decided to drop the functional index and just use a standard unique index. I then added a type constraint check which also enforces the value being hex:

alter table modem add constraint ensure_mac_correct CHECK (mac ~ '^[0-9a-f]{12}$');

Did I ever mention how I love postgres? Take that MySQL!